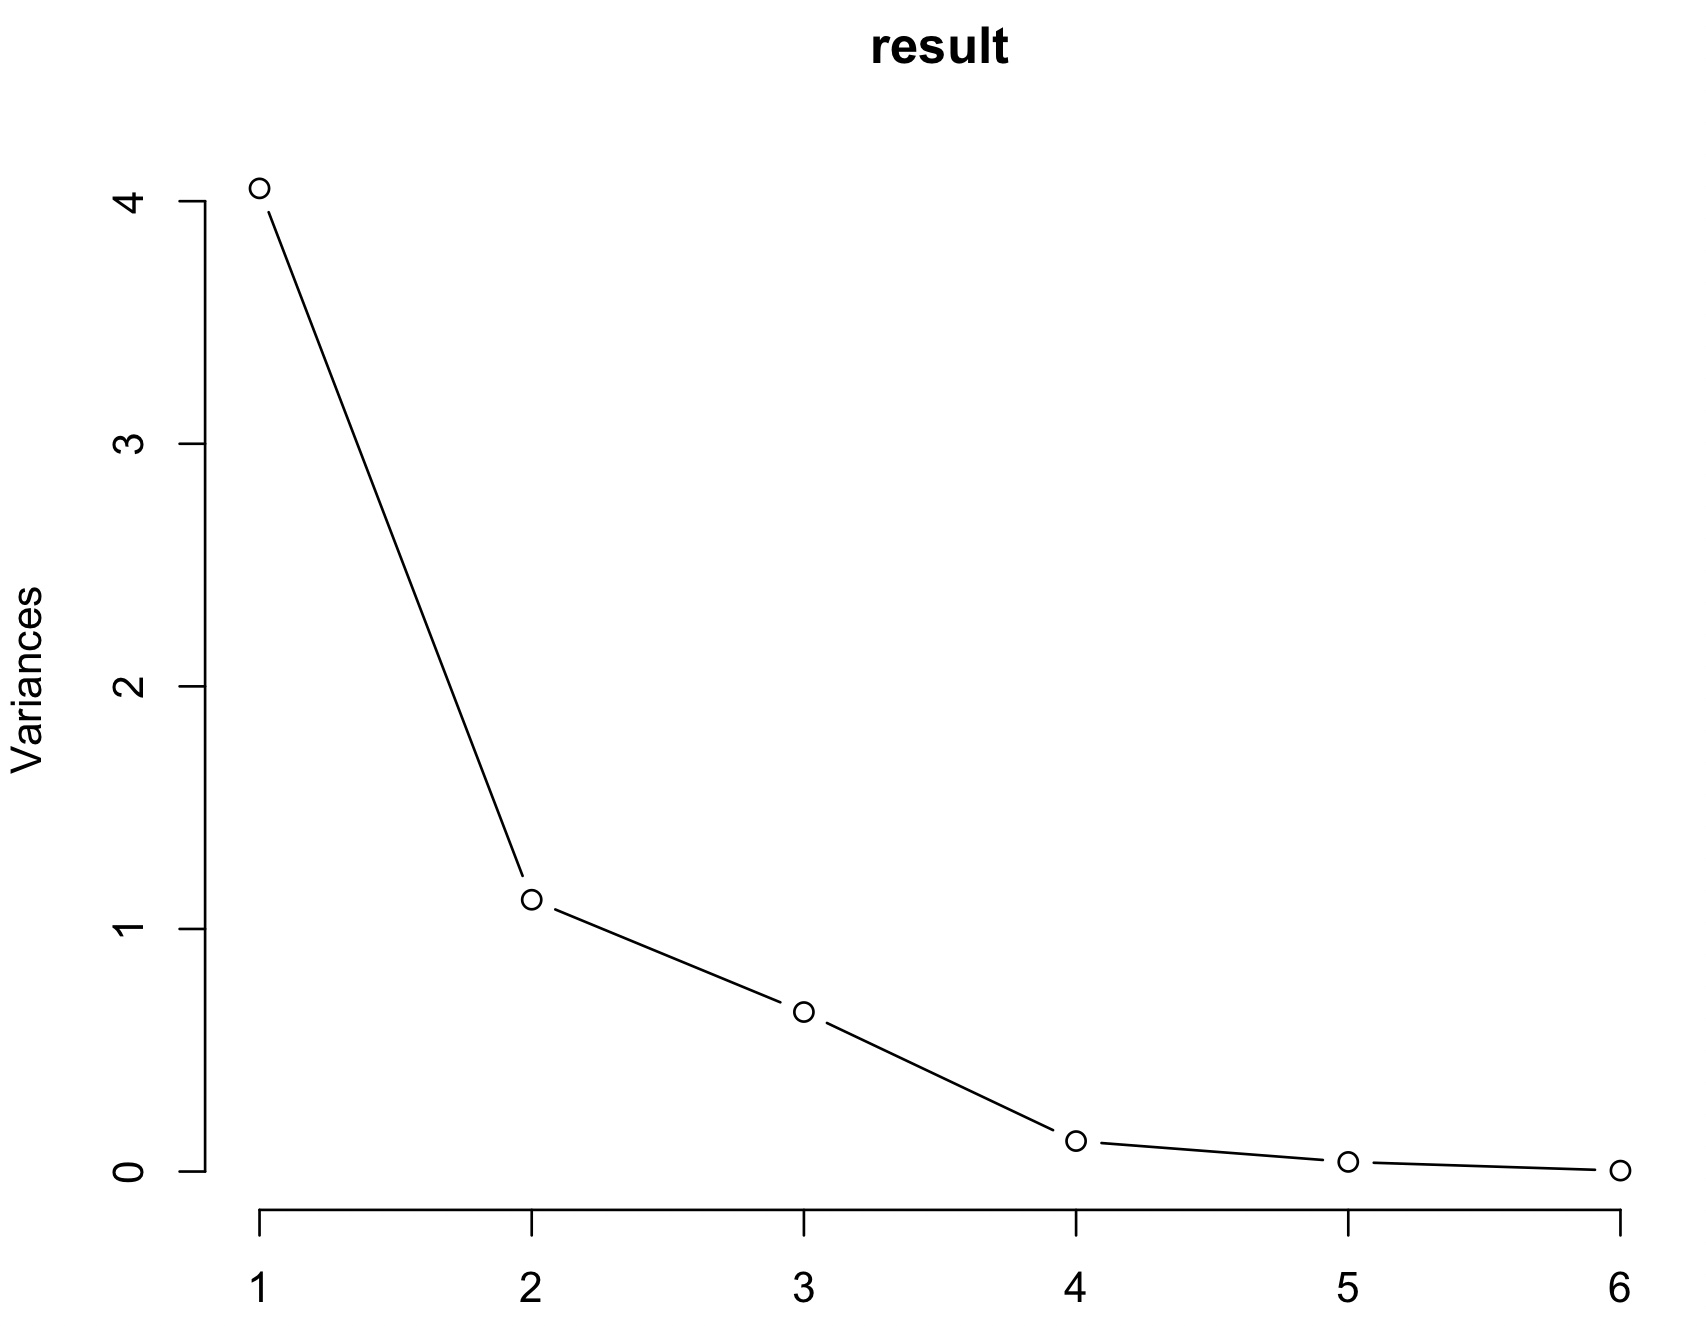
> cal<-c(52, 160, 89, 57, 34, 32, 30, 69)
> car<-c(112.4, 8.5, 22.8, 14.5, 8.2, 7.7, 7.6, 18.1)
> fat<-c(0.2, 14.7, 1.3, 0.7, 0.2, 0.3, 0.2, 0.2)
> pro<-c(0.3, 2.0, 1.1, 0.3, 0.8, 0.7, 0.6, 0.7)
> fib<-c(2.4, 6.7, 2.6, 2.4, 0.9, 2.0, 0.4, 0.9)
> sug<-c(10.4, 0.7, 12.2, 9.9, 7.9, 4.7, 6.2, 15.5)
> fruits<-data.frame(cal, car, fat, pro, fib, sug)
> result<-prcomp(fruits, center=T, scale.=T)
> result
Standard deviations (1, .., p=6):
[1] 2.01314374 1.05853762 0.81088150 0.35447821 0.19925394 0.06216644
Rotation (n x k) = (6 x 6):
PC1 PC2 PC3 PC4 PC5 PC6
cal 0.4497789 0.25668231 0.39132362 -0.13770784 0.172277348 -0.7280357
car -0.1343382 0.86196398 -0.34816436 0.34088787 0.031790681 -0.0231893
fat 0.4899044 0.06599968 -0.03435189 -0.04290641 0.718838104 0.4856835
pro 0.4638167 -0.11821949 0.23112276 0.75978379 -0.345838088 0.1435447
fib 0.4608776 0.27563218 -0.08775242 -0.53083464 -0.577034897 0.2986026
sug -0.3348309 0.31117101 0.81446248 -0.06272348 -0.002897031 0.3518084
> summary(result)
Importance of components:
PC1 PC2 PC3 PC4 PC5 PC6
Standard deviation 2.0131 1.0585 0.8109 0.35448 0.19925 0.06217
Proportion of Variance 0.6755 0.1867 0.1096 0.02094 0.00662 0.00064
Cumulative Proportion 0.6755 0.8622 0.9718 0.99274 0.99936 1.00000

